
Financial KPIs Every Small Business Owner Should Track
Understanding your business’s financial health is crucial for long-term success, yet many small business owners struggle to identify which financial KPIs (Key Performance Indicators) truly matter. According to research from the Federation of Small Businesses, nearly 60% of UK small businesses fail within their first five years, often due to poor financial management and lack of visibility into critical business metrics.
Whether you’re running a startup in Manchester or an established enterprise in London, tracking the right performance indicators can mean the difference between thriving and merely surviving. This comprehensive guide will walk you through the essential financial KPIs that every small business owner should monitor to make informed decisions and drive sustainable growth.
Why Financial KPIs Matter for UK Small Businesses
Financial tracking isn’t just about keeping your accountant happy or satisfying HMRC requirements. Performance indicators serve as your business’s vital signs, providing early warnings about potential problems and highlighting opportunities for improvement. A study by the Office for National Statistics found that businesses that regularly monitor their financial metrics are 3.5 times more likely to achieve year-on-year growth.
Think of business metrics as your navigation system. Without them, you’re essentially driving blindfolded, hoping you’ll reach your destination. With proper financial KPIs in place, you gain clarity, control, and confidence in your decision-making process.
Essential Financial KPIs to Monitor
1. Gross Profit Margin
Your gross profit margin reveals how efficiently you’re producing your products or delivering your services. It’s calculated by subtracting the cost of goods sold (COGS) from revenue, then dividing by revenue and multiplying by 100 to get a percentage.
For most UK small businesses, a healthy gross profit margin ranges between 50-70%, though this varies significantly by industry. Retail businesses typically operate on lower margins (20-40%), while service-based companies often achieve higher margins (60-80%). Monitoring this metric helps you identify pricing issues, supplier cost increases, or production inefficiencies before they seriously impact your bottom line.
2. Net Profit Margin
While gross profit margin focuses on production costs, net profit margin gives you the complete picture by including all operating expenses, taxes, and interest. This performance indicator shows how much actual profit you’re making for every pound of revenue generated.
According to Sage’s Small Business Financial Outlook, the average net profit margin for UK small businesses is approximately 10%. If your margin falls below 5%, it’s time to scrutinise your expenses and potentially revise your pricing strategy. At Kaizen AI Consulting, we help businesses analyse their profit margins and develop strategies to improve profitability through data-driven insights and AI-powered financial analysis.
3. Cash Flow and Cash Runway
Cash is king in business. You can be profitable on paper but still fail if you run out of cash. Your cash flow tracks the movement of money in and out of your business, whilst cash runway tells you how many months you can operate with your current cash reserves before running out.
Data from British Business Bank reveals that 82% of small business failures are attributed to poor cash flow management. Calculate your cash runway by dividing your current cash balance by your monthly cash burn rate. Most financial advisers recommend maintaining at least 3-6 months of runway, though more conservative businesses aim for 12 months.
4. Current Ratio (Liquidity Ratio)
Your current ratio measures your ability to pay short-term obligations and is calculated by dividing current assets by current liabilities. A ratio of 1.5 to 3 is generally considered healthy for most UK small businesses.
If your ratio drops below 1, you may struggle to meet immediate financial obligations. Conversely, a ratio above 3 might indicate you’re not using your assets efficiently. This business metric is particularly important when seeking financing, as lenders scrutinise it closely.
5. Accounts Receivable Turnover
This financial KPI reveals how efficiently you collect payments from customers. It’s calculated by dividing net credit sales by average accounts receivable. A higher number indicates you’re collecting payments more quickly.
The average collection period for UK small businesses is approximately 45 days, though payment terms vary by industry. If your customers are taking 60, 90, or even 120 days to pay, it directly impacts your cash flow. Implementing better invoicing systems and payment terms can dramatically improve this metric.
6. Customer Acquisition Cost (CAC)
Understanding how much you spend to acquire each new customer is crucial for sustainable growth. Calculate CAC by dividing total sales and marketing expenses by the number of new customers acquired during that period.
For context, Forbes reports that the average UK small business spends between £200-£500 per customer acquisition, though this varies widely by industry. The key is ensuring your CAC is significantly lower than your customer lifetime value (more on that next).
7. Customer Lifetime Value (CLV)
CLV predicts the total revenue you’ll earn from a customer throughout your entire relationship. This performance indicator helps you understand how much you can reasonably spend on customer acquisition whilst maintaining profitability.
A healthy business typically maintains a CLV to CAC ratio of at least 3:1, meaning each customer generates three times more value than what you spent acquiring them. If your ratio is lower, you need to either reduce acquisition costs or increase customer retention and average order value.
8. Operating Expense Ratio
This metric shows what percentage of your revenue goes towards operating expenses. Calculate it by dividing total operating expenses by revenue. For most UK small businesses, keeping this ratio below 80% is advisable, with many successful companies operating between 60-70%.
Regular monitoring of this financial KPI helps you identify cost creep before it becomes problematic. Small, incremental expense increases across multiple categories can significantly impact profitability over time.
9. Revenue Growth Rate
Your revenue growth rate measures how quickly your business is expanding. Calculate it by subtracting last period’s revenue from current revenue, dividing by last period’s revenue, and multiplying by 100.
Whilst growth rates vary by industry and business maturity, research indicates that healthy small businesses typically achieve 15-25% annual growth. However, sustainable growth that maintains profitability is more important than rapid expansion that strains resources.
10. Break-Even Point
Your break-even point tells you exactly how much revenue you need to generate to cover all costs. It’s where total revenue equals total expenses, resulting in neither profit nor loss.
Understanding this business metric is essential for pricing decisions, sales targets, and financial planning. If you’re consistently operating near or below your break-even point, you need to either increase sales, raise prices, or reduce costs.
Implementing Effective Financial Tracking Systems
Understanding which financial KPIs to track is only half the battle; implementing systems to monitor them consistently is equally important. Many UK small business owners struggle with this aspect due to time constraints, lack of expertise, or inadequate tools.
Modern accounting software like Xero, QuickBooks, or Sage can automatically calculate many of these business metrics, but interpreting the data and taking action requires analytical skills and strategic thinking. This is where many businesses find value in professional guidance.
Kaizen AI Consulting specialises in helping UK small businesses implement robust financial tracking systems that provide real-time visibility into critical performance indicators. Our AI-powered analytics tools can identify trends and anomalies that might take weeks or months to spot manually, giving you a competitive advantage in today’s fast-paced business environment.
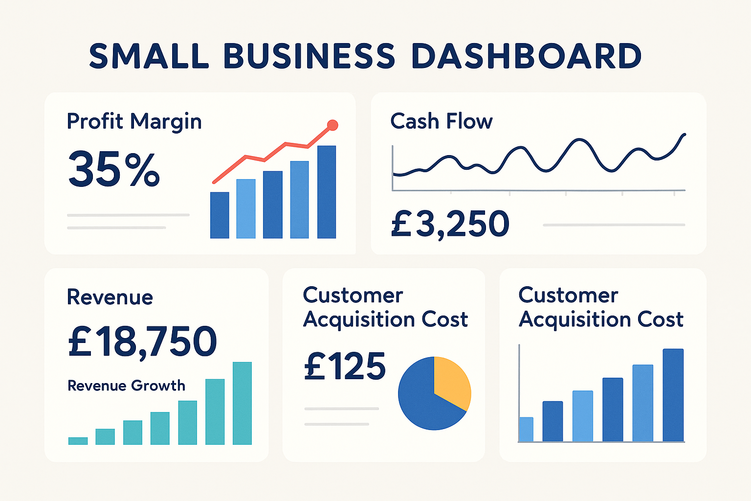
Creating Your Financial KPI Dashboard
Once you’ve identified which metrics matter most for your business, create a dashboard that displays them in an easily digestible format. Your dashboard should be reviewed at least monthly, though some metrics like cash flow warrant weekly or even daily monitoring.
Prioritise the 5-7 financial KPIs most relevant to your current business stage and goals. Trying to track too many metrics can lead to analysis paralysis. As your business grows and evolves, you can adjust which performance indicators you monitor most closely.
Consider segmenting your metrics by department, product line, or customer segment to gain deeper insights. For example, you might discover that one product line has excellent margins whilst another is barely breaking even, or that customers from certain channels have much higher lifetime values.
Common Mistakes to Avoid
Many small business owners make critical errors when implementing financial tracking:
Tracking vanity metrics: Revenue alone doesn’t tell the full story. A business with £500,000 in revenue but only 2% net profit margin is less healthy than one with £250,000 revenue and 20% margins.
Inconsistent monitoring: Checking your business metrics sporadically provides little value. Establish regular review schedules and stick to them.
Ignoring industry benchmarks: Understanding how your performance indicators compare to industry standards helps you identify whether issues are internal or market-wide.
Failing to take action: Data without action is worthless. When your financial KPIs reveal problems, develop and implement corrective strategies promptly.
The Strategic Advantage of Professional Financial Analysis
Whilst many financial KPIs can be calculated with basic accounting knowledge, interpreting trends, identifying root causes, and developing strategic responses requires expertise. Professional business consultants bring experience from working with hundreds of companies across various industries, allowing them to spot patterns and opportunities you might miss.
Advanced analytics and AI technologies can now predict future performance based on historical data, identify optimal pricing strategies, and simulate the financial impact of major business decisions before you commit resources. These capabilities, once available only to large corporations, are now accessible to UK small businesses through specialist consultancies.
Take Control of Your Financial Future
Mastering your business metrics isn’t optional in today’s competitive marketplace. The performance indicators outlined in this guide provide the foundation for data-driven decision-making that can transform your business’s financial health and growth trajectory.
Whether you’re struggling with cash flow, seeking to improve profitability, or planning for expansion, proper financial tracking illuminates the path forward. Start by implementing systems to monitor your most critical financial KPIs, establish regular review processes, and don’t hesitate to seek expert guidance when needed.
Ready to gain complete visibility into your business’s financial performance? Contact Kaizen AI Consulting today to discover how our AI-powered analytics and expert consultancy services can help you track, analyse, and optimise your financial KPIs for sustainable growth. Our team specialises in helping UK small businesses implement sophisticated financial tracking systems that provide actionable insights without the complexity. Let’s transform your financial data into your competitive advantage.