Building an AI-Powered Dashboard for Your Business KPIs
Data is the lifeblood of modern business decision-making, yet too many UK companies are still relying on spreadsheets, outdated reports, and gut instinct to track their performance. In 2026, that approach is no longer competitive. Building an AI-powered dashboard for your business KPIs is no longer a luxury reserved for enterprise-level organisations with deep pockets. It is an accessible, practical, and increasingly essential step for any business that wants to grow with clarity and confidence.
The global business intelligence and analytics market is valued at over $41 billion in 2026, growing at a CAGR of 8.67% towards $62 billion by 2031. Meanwhile, closer to home, research from the University of Cambridge Bennett School found that large UK firms nearly doubled their AI adoption rate between 2023 and 2025, reaching 44%. Smaller businesses are catching up fast, but many still lack the structured frameworks needed to make AI-driven analytics work effectively. That is precisely where the opportunity lies.
What Is an AI-Powered Business KPI Dashboard?
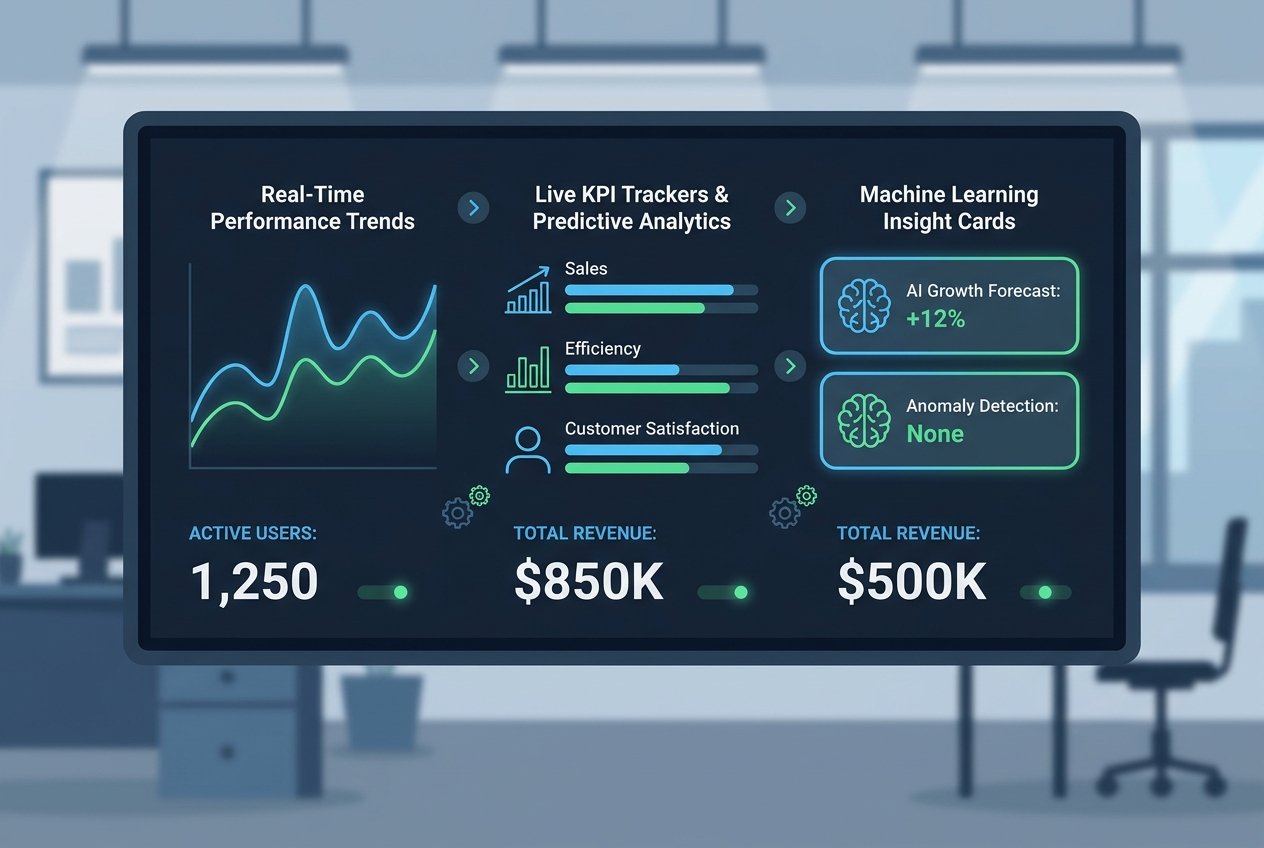
A business KPI tracker has traditionally been a static visual report, updated manually or on a schedule, showing metrics like revenue, customer acquisition cost, or staff productivity. An AI-powered version transforms this entirely. Rather than presenting what has already happened, a performance dashboard AI uses machine learning, predictive modelling, and natural language processing to surface insights in real time, flag anomalies before they become problems, and even suggest corrective actions.
Think of it as the difference between a rear-view mirror and a heads-up display. One tells you where you have been; the other tells you what is ahead and how to navigate it safely.
Key capabilities of an AI-driven dashboard include:
- Real-time analytics that refresh automatically as new data flows in
- Anomaly detection that alerts you when a KPI deviates from expected patterns
- Predictive forecasting based on historical trends and external signals
- Natural language querying, allowing users to ask questions in plain English and receive instant visual answers
- Personalised views tailored to individual roles across your team
Why Real-Time Analytics Matter for UK Businesses
Speed of insight is a genuine competitive advantage. According to Market.us, 70% of organisations will leverage real-time analytics for decision-making by 2025, up from just 40% in 2020. Yet despite this trajectory, a significant number of UK businesses have yet to move beyond monthly or weekly reporting cycles.
The problem with delayed reporting is compounded in fast-moving markets. A drop in website conversion rate spotted three weeks after it begins costs considerably more to resolve than one caught within hours. A sudden spike in customer service queries flagged in real time can prevent a PR issue from escalating. An unexpected dip in sales in a specific region, surfaced immediately, enables targeted intervention before the quarter is lost.
For UK SMEs, where resources are leaner and margins are tighter, this responsiveness is not just helpful. It is critical. Research published in February 2026 shows that 39% of UK businesses are already using AI in some capacity, with nearly 70% either using it or actively considering adoption. Those that build intelligent performance dashboards now will be well-positioned as the gap between data-led and data-blind businesses widens.
Choosing the Right KPIs to Track
Before any dashboard is built, the most important step is deciding what to measure. A common mistake businesses make is tracking too many metrics, producing a cluttered, confusing display that no one looks at. Effective AI dashboard design starts with ruthless prioritisation.
Your KPIs should be directly linked to your strategic objectives. A useful framework is to organise them across four perspectives:
- Financial: Revenue growth, gross margin, cash flow, cost per acquisition
- Customer: Net Promoter Score, customer lifetime value, churn rate, satisfaction scores
- Operational: Fulfilment time, error rate, productivity per employee, project delivery on time
- Growth and Innovation: New product pipeline, market share, lead conversion rates, digital channel performance
Once your core KPIs are defined, AI can be layered on top to enrich them. Rather than simply showing that revenue is down 8% this month, a well-configured performance dashboard AI can contextualise that figure against market benchmarks, correlate it with specific operational inputs, and model the impact of various recovery strategies.
The MIT Sloan Management Review has highlighted how smart organisations are moving towards AI-enhanced KPIs that are dynamic, contextual, and predictive, rather than fixed historical metrics. This shift is fundamental to gaining genuine strategic advantage from your data.
The Building Blocks of a Strong AI Dashboard
Constructing an effective AI-powered dashboard involves several interconnected layers. Understanding these from the outset will save considerable time, cost, and frustration later.
1. Data Infrastructure and Integration
Your dashboard is only as good as the data feeding it. This means integrating all relevant data sources, whether that is your CRM, accounting software, e-commerce platform, marketing tools, or operational systems, into a unified data environment. Cloud-based data warehouses such as Google BigQuery, Amazon Redshift, or Microsoft Azure Synapse provide scalable foundations for this.
Data quality must be addressed from the start. Inconsistent formats, duplicate records, and incomplete fields will undermine even the most sophisticated AI layer. Establishing clear data governance standards early is essential.
2. AI and Machine Learning Layer
Once clean, consolidated data is flowing, AI models can be applied to generate predictive insights, detect patterns, and automate alerts. This layer may involve pre-built AI features within existing BI platforms such as Microsoft Power BI, Tableau, or Looker, or bespoke models developed to suit your specific business logic. Power BI alone commands approximately 30% of the global BI market share, reflecting its widespread adoption across UK businesses of all sizes.
For businesses without in-house data science capability, this is often where specialist support proves its worth. At Kaizen AI Consulting, we work with businesses across the UK to design and implement AI-powered analytics solutions that are tailored to their goals, their data landscape, and their teams’ ability to act on insights.
3. Data Visualisation and User Experience
Sophisticated analytics are useless if people cannot understand or engage with them. Effective data visualisation translates complex outputs into clear, actionable visuals. The best dashboards combine intuitive design with progressive depth, offering an at-a-glance summary for executives whilst allowing operational teams to drill down into granular detail.
Key principles of great dashboard design include:
- Prioritising clarity over comprehensiveness
- Using colour to signal status, not just to decorate
- Designing for the user role, not the data source
- Building in contextual benchmarks so numbers have meaning
- Ensuring mobile accessibility for teams on the move
According to B-EYE’s 2026 BI trends analysis, AI is increasingly generating up to 80% of dashboard visual layouts automatically, with human designers refining the remaining 20% for context and usability. This dramatically accelerates deployment times and reduces the cost of iteration.
4. Governance, Trust, and Human Oversight
As AI becomes more embedded in business decision-making, governance becomes non-negotiable. Businesses must ensure that the insights produced are auditable, that the underlying models are understood, and that human judgement remains part of the decision loop. This is not merely a technical concern; it is a leadership and cultural one.
Building a culture where teams trust the data, challenge the outputs, and continuously refine the models is just as important as the technology itself. As we explore elsewhere on the Kaizen AI Consulting blog, sustainable AI adoption is rooted in strong leadership and a clear organisational vision.
Common Pitfalls to Avoid
Many businesses invest in dashboard tools only to find that adoption stalls or insights go unactioned. The most common reasons are:
- Starting with technology rather than strategy: The tool should serve the business question, not the other way around.
- Overcomplicating the initial build: A focused dashboard tracking five meaningful KPIs will drive more value than an elaborate one tracking fifty.
- Neglecting change management: Teams need training, context, and confidence to act on AI-generated insights. Deployment without adoption is wasted investment.
- Poor data hygiene: Garbage in, garbage out remains the cardinal rule of any analytics initiative.
- Lack of iteration: A dashboard is not a one-time project. It should evolve as the business grows and strategy shifts.
The UK Opportunity: Why Now Is the Right Time to Act
The UK Government’s own Technology Adoption Review estimates that AI could boost UK productivity by 1.5% per year, contributing up to £47 billion annually to the economy over the next decade if widely embraced. For individual businesses, the competitive stakes are clear: those that build data intelligence into their operations now will set the pace for their sectors.
The barriers are lower than many assume. Cloud-based AI analytics platforms are available from as little as £50 per month for SMEs. Pre-built connectors mean integration with popular tools like Xero, Shopify, Salesforce, and HubSpot is often achievable within days rather than months. And with the right expertise guiding the process, a functional, AI-driven business KPI tracker can be live and delivering value within a matter of weeks.
Ready to Build Your AI-Powered Dashboard?
Whether you are starting from scratch or looking to supercharge an existing reporting setup, building a robust AI dashboard is one of the highest-value investments a business can make right now. The key is approaching it with the right strategy, the right data foundations, and the right partner.
At Kaizen AI Consulting, we specialise in helping UK businesses harness the power of real-time analytics and AI-driven insights to make smarter, faster, and more confident decisions. From KPI strategy and data architecture through to dashboard design and team enablement, we provide end-to-end support tailored to your business.
Get in touch with the Kaizen AI Consulting team today to discuss how we can help you build a performance dashboard that transforms the way you lead your business. Contact us here to start the conversation.